First off, I am deploying the application in a local tomcat, so I need to be able to debug what eclipse considers an external server ( as opposed to having eclipse / gwt spin up a server within eclipse ). A quick google search for the keywords of interest brings up as the first result a very helpful stackoverflow answer:
- Get google plugin for eclipse
- The in eclipse, right click on your project and choose Debug as -> Web Application (running on external server)
- Enter URL of your web app on tomcat (like http://localhost:8080/YourApp/YourApp.html and eclipse will give you new one - it will add stuff like ?gwt.codesvr=127.0.0.1:9997
Simple, right? Sadly step 2 did nothing for me. I select it, and nothing happens. So what I ended up doing was to set up my own debug configurations. When I did this, I kept getting this annoying error:
Working directory does not exist: /Users/myStuff/Documents/workspace/myProject-TRUNK/webapp/helloWorld/target/helloWorld-webapp-1.7-MS2.01-SNAPSHOT
I thought that perhaps this may have been related to the fact that we use maven and maybe that was throwing another complication into the mix. As it turns out, if you don't provide a location of the deployed war to the configurations, GWT tries to access what it thinks the location. The directory does in fact not exist, nor is it where my deployed war lives. After some random clicking around and setting the directory to different places that may make sense, I figured out what it was looking for. So, in summary, this is another way to get the GWT debugger to work by manually configuring things:
- In eclipse, right click on your project and choose Debug as -> Debug Configurations ...
- In the left hand panel, scroll down to "Web Application", select it and then click new.

- Click on the New_configuration to edit it
- In the Main tab, change the name of the configuration to something meaningful to you so you know what this configuration is for. The project should be pre-filled with the name of the GWT app that you right clicked over. If it isn't, or it is not correct, click on the browse button to select the project. This was a slight point of confusion for me, what project should I use? The code base I work on is very large with many modules. I chose the entry point into the application for the client as the GWT project ( and I chose correctly it seems ). I didn't know what main class to use or read up on what my options were, so I just left the default value.

- Now go to the Server tab. Because I am running tomcat locally on my machine, I do not want to use the embedded server, so uncheck this option.

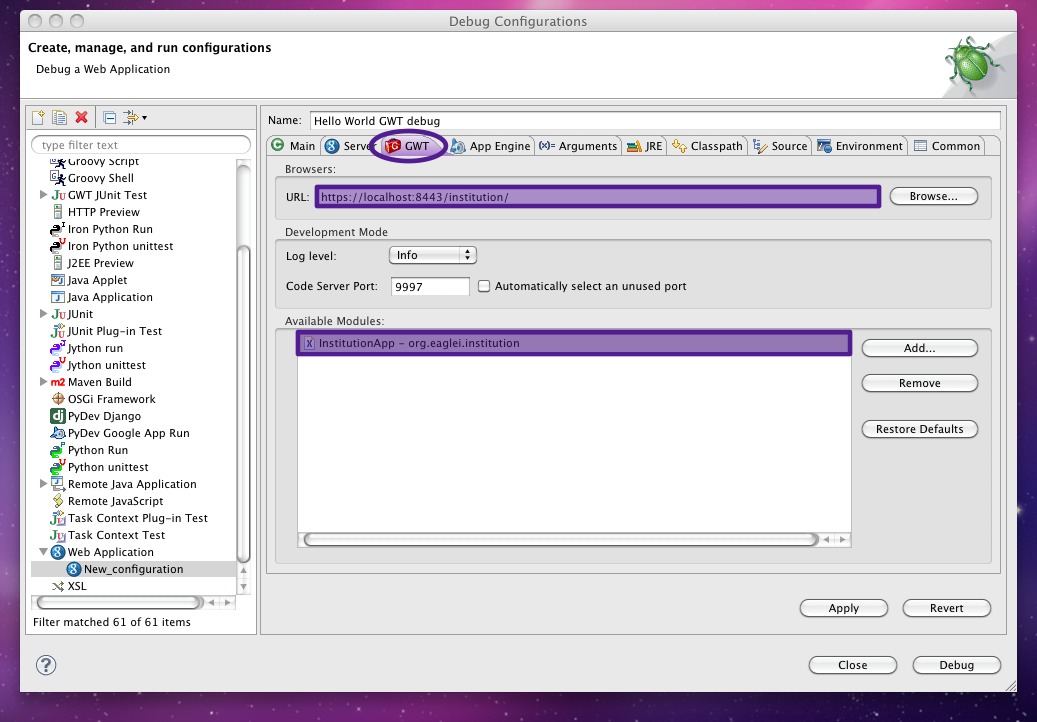
- Now go to the GWT tab. Type in the name of the URL you would use in a browser to access your application. If you don't see the URL field, you probably forgot to uncheck the use embedded server in the previous step. In my case, my application is running on https and the url needs to reflect this. Additionally, note that the class that has your entry point should show up here.
- Now go to the Arguments tab. Here's where I ended up flailing for a bit. At the beginning of the program arguments, add the following:You should use the fully qualified path to the your deployed application folder (not the *.war file)-war /opt/tomcat6/webapps/helloWorld/

- Finally, you should probably add all the source for your project if you want to step through the debugger to the Source tab.


And that's it! When you click on debug, you should see a tab on your screen where your console is that says "Development Mode". One other probably obvious thing is that you want to start up tomcat first before clicking debug. After this, you'll see in the Development Mode console a URL you can copy and paste into a browser and use for debugging the client side.
Yes, I know, this should be simple and straight forward, but I figured if I was having trouble ... I'm sure (hopefully) someone out there on the interwebs is having similar troubles.